
Why 100% Renewable Energy Does Not Always Mean Renewable Power Around the Clock
Understanding energy balance, hourly supply gaps, and the practical role of storage.
A facility consumes one million megawatt-hours of electricity in a year. A renewable energy portfolio generates exactly the same amount over that year. Has the facility secured a continuous renewable power supply?
The annual totals match. But those totals do not tell us whether electricity was generated when the facility needed it.
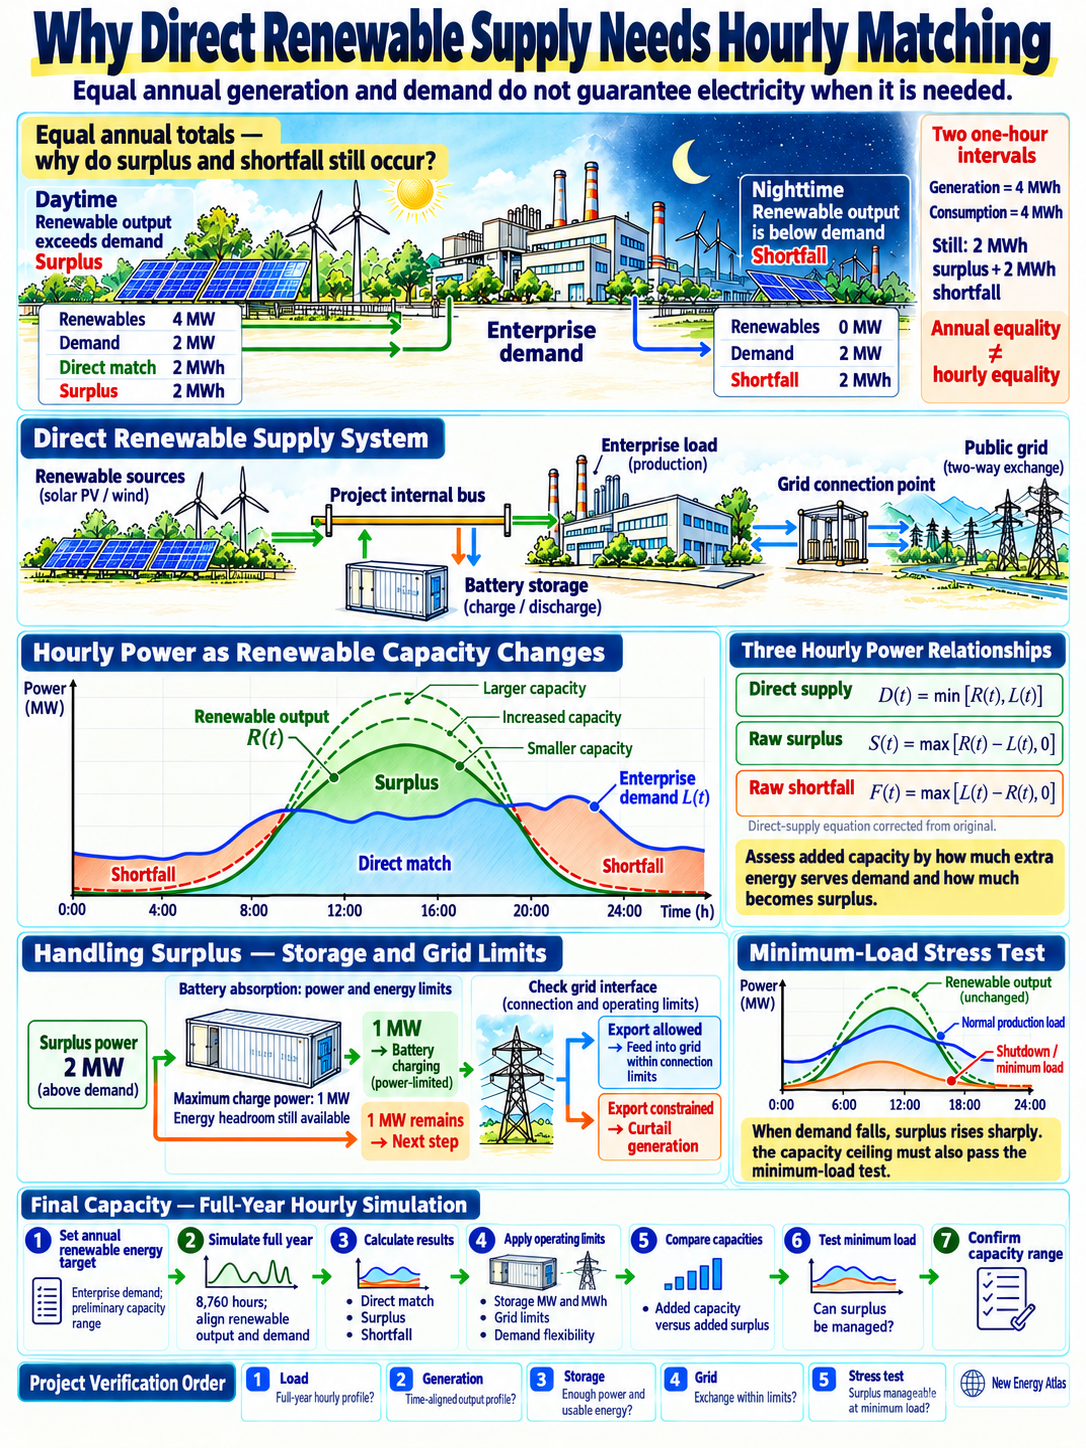
This is the central lesson behind the poster: matching the quantity of energy is different from matching the timing of supply.
For readers involved in renewable energy, industrial facilities, or data centers, understanding this distinction is essential. It changes how we assess generation capacity, size batteries, structure power purchases, and describe a project’s renewable energy performance.
1. Start with the difference between power and energy
Power is the rate at which electricity is generated or consumed at a particular moment. It is measured in kilowatts or megawatts.
Energy is the quantity generated or consumed over a period. It is measured in kilowatt-hours or megawatt-hours.
The relationship is straightforward:
Energy (MWh) = Average power (MW) × Time (hours)
A facility drawing a constant 100 MW consumes:
- 100 MWh in one hour.
- 2,400 MWh in one day.
- 876,000 MWh in a 365-day year.
A renewable portfolio might produce 876,000 MWh annually while supplying much more than the facility needs during some hours and very little during others.
The annual calculation answers, “How much electricity was produced?” It does not answer, “Was sufficient electricity available whenever it was needed?”
2. How to read the poster’s supply and demand curves
Think of the poster as a comparison between two profiles: electricity demand and renewable generation.
Where generation exceeds demand, there is a surplus. That electricity needs somewhere to go: storage, another consumer, the grid where exports are permitted, or curtailment.
Where generation falls below demand, there is a shortfall. Another source must supply the missing power, or consumption must decrease.
Where the two profiles overlap, renewable generation can serve demand at the same time, subject to network and equipment constraints.
For a simple system without storage, direct renewable supply is therefore:
Direct supply = The smaller of renewable generation and demand
In mathematical form:
P_direct(t) = min[P_RE(t), P_load(t)]
The corresponding surplus and shortfall are:
P_surplus(t) = max[P_RE(t) − P_load(t), 0]
P_shortfall(t) = max[P_load(t) − P_RE(t), 0]
These equations describe power at each moment. To calculate energy, multiply by the interval duration and add the results across the study period.
This distinction also matters when interpreting the graphic: the height of a power curve represents MW; the area beneath it represents MWh.
3. A simple example: equal energy, incomplete coverage
Consider a facility consuming a constant 100 MW over two one-hour periods.
| Item | Hour 1 | Hour 2 | Total energy |
|---|---|---|---|
| Facility demand | 100 MW | 100 MW | 200 MWh |
| Renewable generation | 160 MW | 40 MW | 200 MWh |
| Renewable power serving demand directly | 100 MW | 40 MW | 140 MWh |
| Renewable surplus | 60 MW | 0 MW | 60 MWh |
| Supply shortfall before storage or other sources | 0 MW | 60 MW | 60 MWh |
Generation and consumption both total 200 MWh. Yet only 140 MWh of demand is served directly by renewable generation.
The remaining 60 MWh is needed in the second hour, while the surplus occurred in the first.
Without storage or another balancing arrangement, surplus electricity from an earlier hour cannot simply be carried forward.
This example also reveals two different performance measures:
Renewable share of demand: How much of the facility’s consumption is served by renewable electricity?
Renewable self-consumption: How much of the renewable generation is used by the facility?
Here, both happen to equal 70%. In other systems, they can differ substantially because their denominators are different.
4. What a battery can—and cannot—solve
A battery can absorb surplus electricity and discharge it later. This shifts energy from a period of excess generation to a period of shortage. Energy storage is widely used to improve the use of variable wind and solar output.
But a battery must satisfy two separate requirements.
Its MW rating determines how quickly it can charge or discharge.
Its MWh rating determines how much energy it can store.
In the example, shifting the full surplus would require at least 60 MW of charging capability, 60 MW of discharging capability, and sufficient usable energy capacity. Those requirements assume ideal operation.
Real batteries introduce losses. If the complete charge-to-discharge cycle has an illustrative efficiency of 90%, charging with 60 MWh returns approximately 54 MWh. A 6 MWh gap remains.
An annual renewable balance that looked sufficient before storage may therefore become insufficient after storage losses.
Battery planning must also consider operating reserves, usable state-of-charge limits, degradation, temperature, equipment availability, and auxiliary consumption.
Storage moves energy through time; it does not create additional energy.
5. Why a “four-hour battery” is not a complete supply strategy
A battery rated at 50 MW/200 MWh has a nominal duration of four hours when discharging at 50 MW.
For a 100 MW facility, that same battery can supply only half the load at any instant. Dividing 200 MWh by 100 MW gives two hours mathematically, but the battery’s 50 MW discharge limit prevents it from supplying the entire facility.
Both limits must be checked together.
The same logic applies to longer shortages. A system capable of shifting afternoon solar into the evening may still be unable to cover several days of weak renewable production.
The appropriate storage configuration depends on the duration, depth, and frequency of the actual shortfalls—not simply the facility’s annual consumption.
6. More renewable capacity helps, but timing still matters
Adding solar or wind capacity can increase renewable coverage. However, its value depends on when the additional electricity is generated.
If demand is already fully covered at midday, adding more solar may mainly increase midday surplus. That surplus becomes useful only if it can be stored, exported, or consumed by flexible demand.
Combining wind and solar may improve coverage where their production profiles complement each other. The benefit must be tested with site-specific, time-aligned data.
The practical question is therefore:
How much additional demand does the next increment of generation or storage actually serve?
That question is more useful for design than comparing installed renewable MW with facility MW.
7. Annual matching, hourly matching, and reliability
These concepts answer different questions.
| Concept | Main question |
|---|---|
| Annual renewable matching | Does eligible renewable generation or procurement equal consumption over the year? |
| Hourly clean-energy matching | How closely does eligible clean generation match consumption in each hour and relevant location? |
| Supply reliability | Can the electrical system maintain service through disturbances, shortages, and equipment failures? |
Hourly matching adds time and location to the assessment. The US Environmental Protection Agency explains that annual matching can support clean generation while leaving periods when electricity demand is not matched by clean supply.
Hourly accounting also does not, by itself, establish a physically dedicated supply or an island-capable system.
A facility can achieve a high annual renewable match and still rely on the grid during shortages. Conversely, a highly reliable facility may use backup generation that does not meet its renewable energy objectives.
For a data center, renewable procurement, UPS autonomy, standby generation, and electrical redundancy must therefore be assessed as distinct parts of the overall design.
8. How to turn the poster into a practical engineering study
The poster explains the principle. A project study needs chronological data and explicit operating constraints.
A useful workflow is:
- Define the load. Establish the facility’s actual electricity demand, including cooling, auxiliaries, growth, and operating variations.
- Build renewable profiles. Use solar and wind output aligned to the same timestamps as demand.
- Calculate direct supply. Identify the surplus and shortfall in every interval.
- Simulate storage. Track charging, discharging, losses, state of charge, and equipment limits through time.
- Apply grid constraints. Include import and export limits, connection availability, and relevant operating restrictions.
- Test difficult periods. Examine prolonged low-generation events, equipment outages, and different weather years.
- Compare configurations. Assess renewable coverage, residual imports, curtailment, reliability, and cost together.
Hourly data provides a useful starting point for energy matching. Faster operational studies are needed where the question involves power quality, protection, rapid load changes, or ride-through performance.
The lesson behind the poster
A successful renewable power strategy needs more than enough electricity on an annual spreadsheet. It needs a workable arrangement for delivering electricity when demand occurs.
Generation determines how much renewable energy is available. Storage changes when some of that energy can be used. Grid access and other supply resources address the remaining gaps. Electrical architecture determines how reliably power reaches the load.
For readers evaluating a “100% renewable” claim, the most useful follow-up is simple:
Over what period is supply matched to consumption, and what supplies the facility during the unmatched hours?
